The pattern still holds, even when accounting for potential limitations
April 5, 2018 by Aaron Howard in Analysis with 0 comments
The early portion of the 2018 season has been exciting, with unexpected comebacks, close finishes, and blowouts. However, one thing that has held true throughout is that top finishers have had very good long distance accuracies and middling intermediate and short distance accuracies. Again, this pattern has held for all PDGA National Tour and Disc Golf Pro Tour events this year, including the most recent Waco Annual Charity Open. It held for both the MPO and FPO divisions. It held for all course types, be they open or wooded, and the pattern even holds for tournaments in previous seasons.
To arrive at this very broad conclusion, I expanded upon the accuracy analysis I presented after the 2018 Memorial Championship. Specifically, using statistics from UDisc Live I produced long, intermediate, and short distance accuracy scores1 for both divisions at the Las Vegas Challenge, Memorial Championship (2017 and 2018), and Waco Annual Charity Open (2017 and 2018). To ensure that I had enough data to represent wooded courses, I also included results from the 2016 and 2017 Vibram Open. In total, the dataset includes 938 rounds played by 534 competitors in the MPO division and 141 rounds played by 61 competitors in the FPO division.
Initial Results and Observations
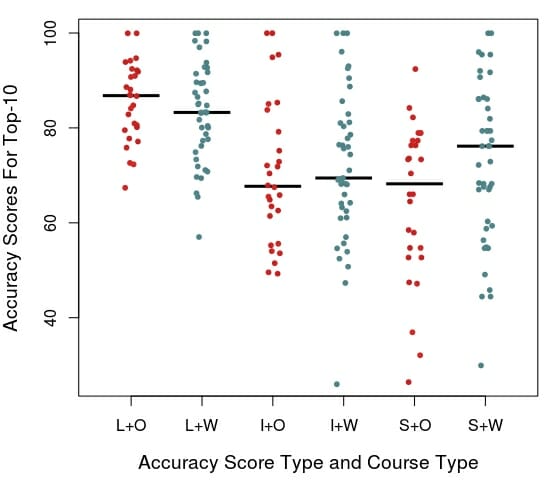
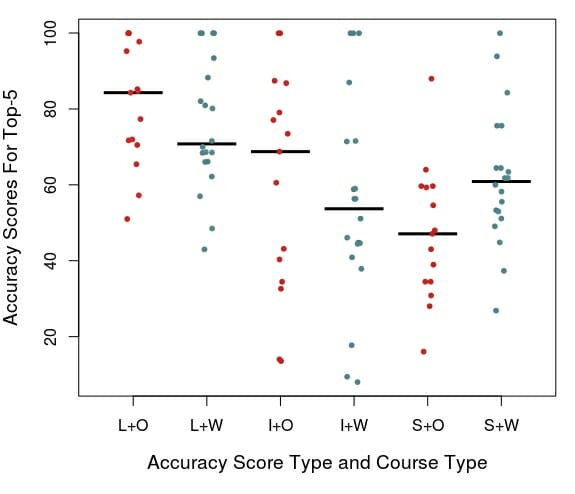
Overall, the pattern for both the MPO and FPO divisions resemble the pattern I described in the previous article. Long distance accuracy has more explanatory power, in terms of the place a player finishes in a tournament than either intermediate or short distance accuracies. This is well illustrated in the accuracy score plots of top-10 (MPO) and top-5 (FPO) finishers. There is much less variation (or spread) in the long distance accuracy scores than the other two. For MPO, the median long distance score for tournament winners was 98.3, whereas the median intermediate and short distance scores for winners were 68.1 and 73.3. For FPO, the scores were: 95.2, 77.1, and 60, respectively.
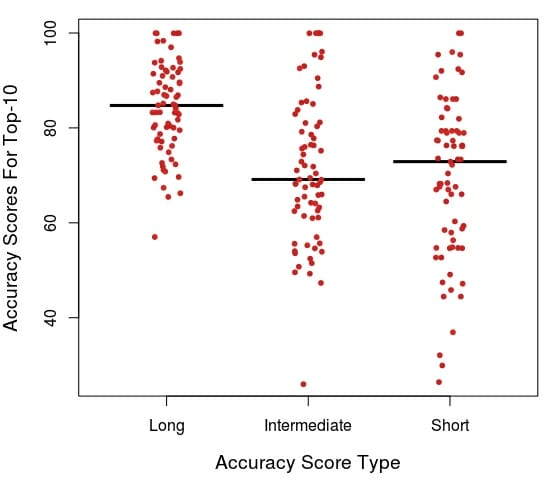
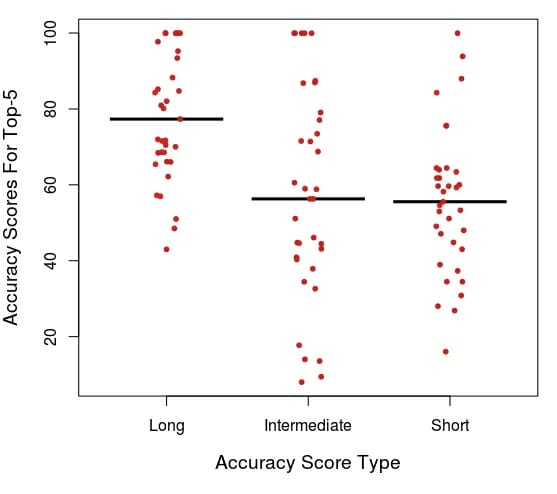
Diving a little deeper into the data, Paige Pierce had the highest average (across all tournaments) long distance score in FPO at 90.9, and finished, on average, in first place. Simon Lizotte had the highest long distance score in the MPO at 89.4,2 and his average finish was 3.6. Averaging across all three distance scores and all tournaments, Ricky Wysocki’s score of 77 was the highest in MPO. Once again, Paige Pierce had the highest score for FPO at 72.
The Myth of Inflated Circle 1 Putting Statistics
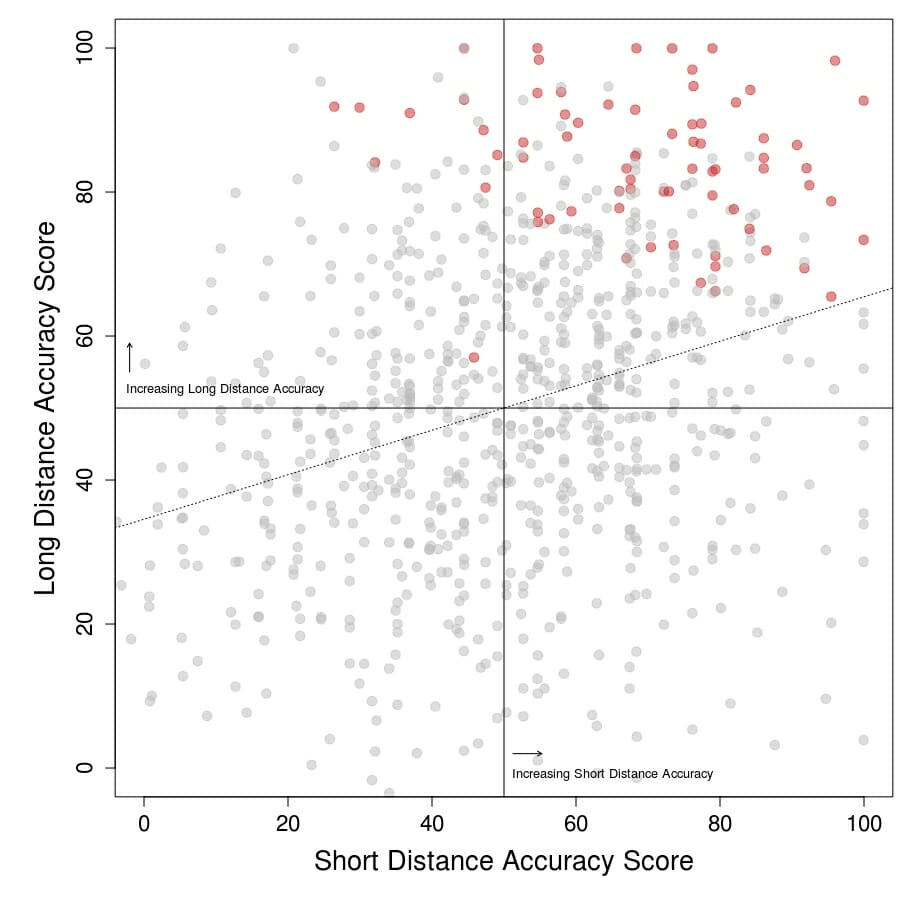
One potential limitation of these data that we mentioned in the previous article was the possibility for inflated circle 1 putting percentages (short distance accuracy) for players that had below average long distance accuracy. If this is, in fact, an actual limitation one would expect short distance accuracy to increase as long distance accuracy decreases. In statistical terms, this would be called an inverse relationship.
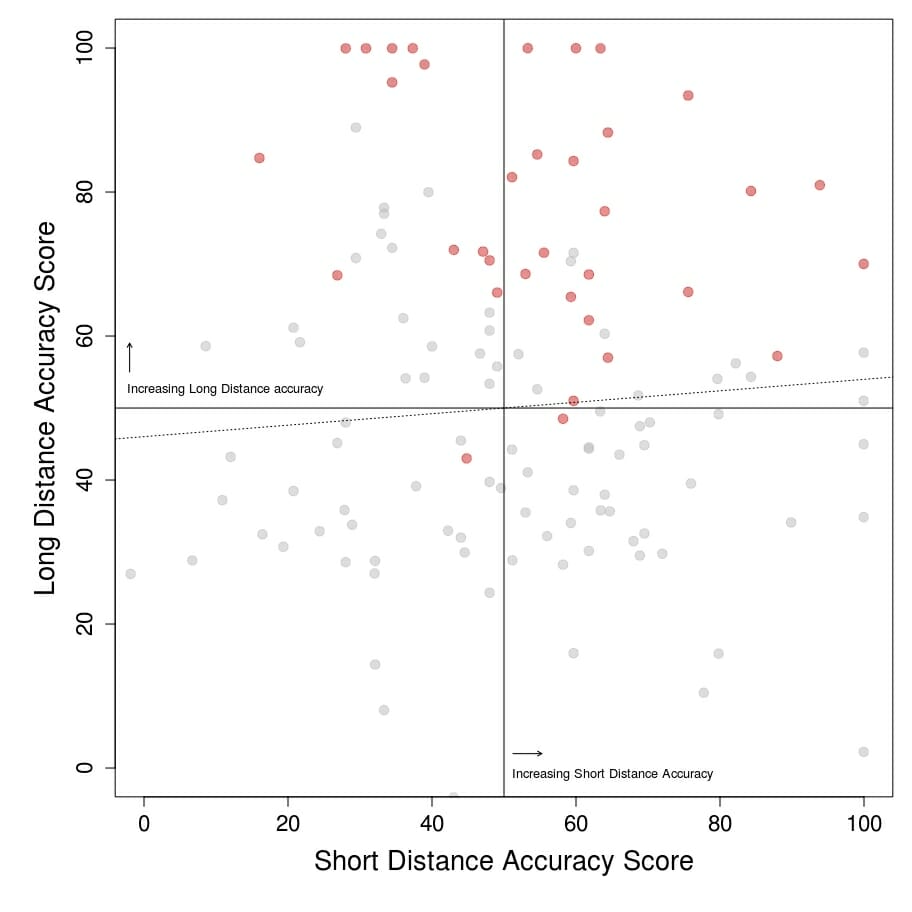
However, the data indicate that this is not true for both the MPO and FPO divisions. In fact, for MPO, short distance accuracy increases as long distance accuracy increases.3 You can clearly see this relationship with the dotted line in the scatterplot below of long versus short distance accuracies. You may notice in the FPO plot that the dotted line follows a similar pattern to the MPO line, however, it is not statistically significant, indicating that there is no relationship between long and short distance accuracy scores.
All this means that the lack of predictive ability by short distance accuracy is not biased by long distance accuracy. Note that those in the top-10 MPO plot and top-5 FPO plot tend to be in the top half of each plot, which indicates above average long distance accuracy. Most, but less so than for long distance accuracy, tend to also be in the right half of the plots, indicating that they are good putters. The best players tend to be in the top right quadrant, indicating that they are above average in both long distance accuracy and putting. However, the trend is much stronger for long distance accuracy. Generally speaking, long and short distance accuracies increase with each other.
The Myth of Course Type (Wooded vs. Open)
Another important limitation of the data from the previous article was that it used results from tournaments played on relatively open courses. The larger dataset used for this analysis includes results from both open courses (LVC and The Memorial) and wooded courses (WACO and Vibram Open). As previously mentioned, overall, the pattern of long distance dominance still holds, but for the sake of being thorough, I split out the accuracy score plots by course type. And what you should be able to see in the plots below is that, generally, the same pattern holds for wooded and open courses: there is no difference in the greater relative importance of long distance accuracy compared to short distance accuracy on courses of different styles.
You may notice that the median value for short distance accuracy is higher in wooded than open courses, but, for both MPO and FPO, it is still statistically significantly smaller than the median for long distance scores and has higher variation.4 For example, in the FPO division, the median long distance accuracy score for wooded courses is 70.8, whereas the median short distance accuracy score is ten points smaller, at 60.8. Both are above the average of 50, but the long distance accuracy score is significantly higher.
Conclusions
In summary, long distance accuracy is more important to success in high-level professional tournaments than either intermediate or short distance accuracies.5 I feel it is critical to note that this does not mean that putting is not important to success in professional disc golf (see my article on the importance of putting in the FPO division at WACO). However, it is less important than long distance accuracy, and this pattern is independent of course type (open or wooded) and division (MPO or FPO). In short, I stand by my reversal of the old adage: “you drive for dough and putt for show!”
I used a statistical procedure called factor analysis to determine which variables group together the “best”, or correlate well with each other. This correlation suggests there may be some underlying factor that influences all highly correlated variables. For example, fairways hit, holes parked, and circles 1 and 2 in regulation are all highly correlated with each other because they are indicative of long distance accuracy. ↩
For players that participated in more than two tournaments. Lizotte played six of the tournaments. ↩
The slope of the best-fit line between long and short distance for MPO is 0.32 with a p-value of >2×10-16. Even though the relationship is statistically significant, long distance accuracy does not do a good job of predicting short distance accuracy because the proportion of variance in short distance accuracy explained by long distance accuracy (R2) is only 9.8%. For FPO, the best-fit line is 0.07 with a p-value of 0.388. This is a high p-value and indicates there is no statistical relationship between long and short distance accuracies. ↩
I used Wilcoxon rank sum tests to determine if the long distance and short distance accuracies scores are statistically significantly different (MPO: W = 1273, p-value = 0.002647; FPO: W = 296, p-value = 0.009776). ↩
As the 2018 season—filled with more UDisc Live statistics than ever—continues I will update this analysis. ↩